Blacks Waited Longer to Vote in 2016, but Not Due to Partisanship
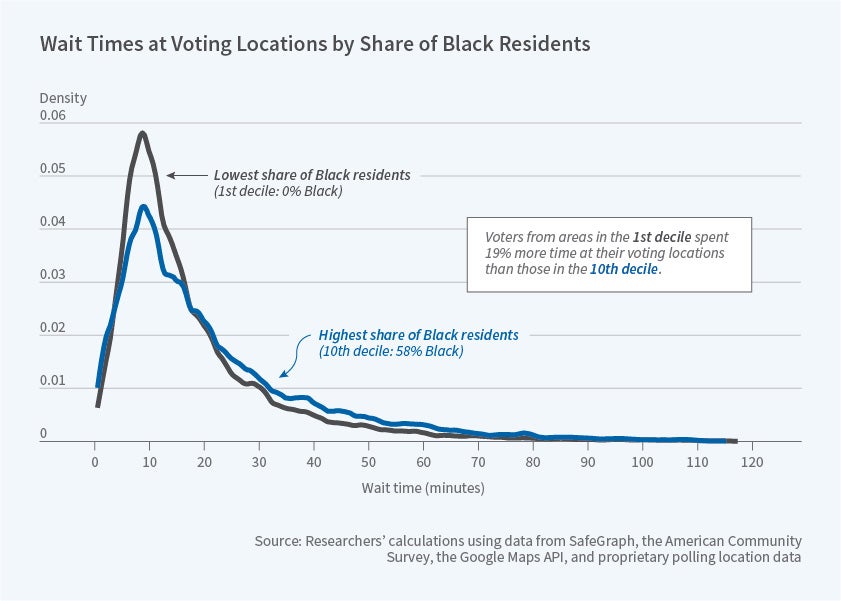
Voters in entirely black neighborhoods were 74 percent more likely to spend more than 30 minutes at the polls than those in entirely white neighborhoods.
Black people waited longer to vote than whites during the 2016 election, and there was no association between the length of the waiting time and which political party was in power in the voting jurisdiction. Those are two of the findings in Racial Disparities in Voting Wait Times: Evidence from Smartphone Data (NBER Working Paper 26487), by M. Keith Chen, Kareem Haggag, Devin G. Pope, and Ryne Rohla.
The study draws on nationwide records of smartphone pings for 154,495 individuals identified as likely voters across 43,414 polling locations. It used anonymized data provided by SafeGraph, a company that aggregates location data from smartphone applications. Close to 80 percent of US adults were estimated to have owned smartphones in 2016. The researchers used cellphone pings to pinpoint people who came within a 60-meter radius of a polling place on election day. They checked cell data for the week before and after the election to eliminate from the sample individuals who may live or work near a polling station. Also filtered out were individuals who spent more than two hours at the polling location, such as election workers.
The study found that, nationwide, voters spent an average of 19 minutes at polling locations, with 18 percent spending more than 30 minutes. The states with the longest average wait times were Utah (28 minutes) and Indiana (27 minutes) and the shortest, Delaware and Massachusetts (12 minutes each).
Voters at polls in all-black areas waited an average of five minutes longer at the polls than voters in neighborhoods with no black voters. Wait times were also higher in Hispanic neighborhoods than they were in white areas, but the differential was not as pronounced as it was for black neighborhoods.
What accounts for the racial disparity? Not partisan politics. Whether a precinct was located in a Republican-dominated county or state made no difference in wait times. Differences in voter ID and early voting laws were not significant factors either. The researchers did find that the racial disparities were larger at high-volume polling places. At polling places that fall in the 10th percentile (1,150 registered voters), the average black-white disparity was 3.7 minutes, compared with 7 minutes at polling places in the 90th percentile (5,242 registered voters).
Looking ahead to the 2020 election, they say that mining smartphone data could be a relatively cheap and efficient way to track wait times and racial disparities across different regions.
—Steve Maas